Multi-Omics Analysis on the CGC: Applications in Epigenetics Research
The Value of Multi-Omics Analysis
The growing diversity of large cancer datasets has led to increased capabilities for multi-omics research. Multi-omics analysis is a promising approach to reveal the functionality of complex biological systems and processes. However, multi-omics analysis is a complex process that needs to be carefully designed and conducted, beginning from sampling all the way through to the interpretation of results. There are countless applications where multi-omics analysis could provide new insights into disease biology: by disease subtyping and classification based on multi-omics profiles, for example, as well as for the prediction of biomarkers for diagnostics. In precision medicine applications, multi-omics analysis can be used for the Identification of the driver genes of the disease-specific to a patient. Multi-omics analysis can also be used for clinical assessment predictions and risk prediction.
Challenges in Multi-Omics Analysis
There are numerous logistical challenges to performing multi-omics analysis. Large, heterogeneous, multi-omics data sets can negatively impact data transfer and management, which traditionally can lead to computationally-intensive analysis. For example, files produced by modern next-generation sequencing (NGS) technologies are often quite large, and difficult to transfer, manage, and process. As such, researchers will need flexible computational resources to process them, but also to control and optimize costs of doing so. There is also the issue of heterogeneity of individual -omics datasets, which are often heterogeneous in the sense that they are generated by a wide range of platforms in a variety of formats, requiring reformatting and unification of the data, and may also require a variety of tools for secondary analysis. Another difficulty in preparing a multi-omics analysis is the lack of formal methodology on which to base a research process. Instead of a defined framework of multi-omics analysis, a number of statistical and machine-learning methods have been adopted and used for these purposes. There has been a surge in the creation of numerous methods for multi-omics analysis in recent years, and this has made it difficult for researchers to identify the right tool for their own particular research needs without advanced training.
The unique research hypothesis to test within a given multi-omics analysis is only half of the challenge, there are also many technical questions to consider when choosing methods for analysis methods. Such as which types of multi-omics platforms provide the most value, or how are the samples collected and prepared? How is the multi-omics data going to be integrated? Choosing the right methods for data integration and analysis is mainly driven by the application and the hypothesis that is the focus of research. For example, a researcher may wish to find disease subtypes based on data modalities from different -omics experiments, or identify driver genes of certain diseases that are specific to a certain patient.
Efficient Multi-omics Analysis Made Possible on the CGC
Overall, researchers seeking to perform multi-omics analysis need flexible computational resources to process such large files and datasets, along with features for controlling and optimizing cloud costs. Also, researchers will need a file management system to easily store their files and share them with collaborators. Regardless of chosen methods or application, almost all multi-omics analyses will have a flow similar to that depicted in Figure 1 below. First, researchers start with a hypothesis important to your research. Based on the hypothesis, they next will design an experiment, collect samples, and process them with different -omics technologies (NGS, mass spec, or similar). Next, the researcher will obtain the resulting raw data files with diverse contents and formats, which they will want to analyze jointly.
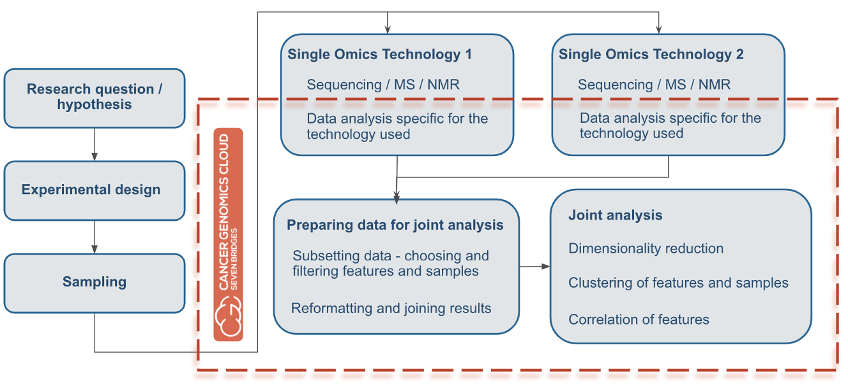
Figure 1: Multi-Omics Analysis Flow. The orange line surrounds all the subsequent tasks that can be done using the CGC platform for multi-omics analysis.
This is where the CGC can streamline multi-omics analysis. The orange line in Figure 1 surrounds all subsequent tasks that can be performed in multi-omics analysis by using the CGC platform. Users can perform data analysis, prepare data for joint analysis, and subsequently perform the joint analysis, all in one project without the need for transferring data. In addition, all of these processes can be done with all of the options for collaborative research that the CGC provides.
The CGC has a history of working with a variety of multi-omics data. In the past decade, the platform has grown both in terms of services offered and has become a hub for sharing data coming from many different -omics datasets, adding new datasets nearly every quarter. New datasets include sources such as TCGA, CPTAC, data from the ICGC data portal, and many others (see Table 1). Within this variety of datasets, researchers can find data from various different experimental setups, such as RNA-seq, WES, WGS, ATAC-seq and ChIP-seq, proteomics, and even imaging. Data is stored in many formats, from raw unprocessed data such as FASTQ files, to VCF and gene expression tables.
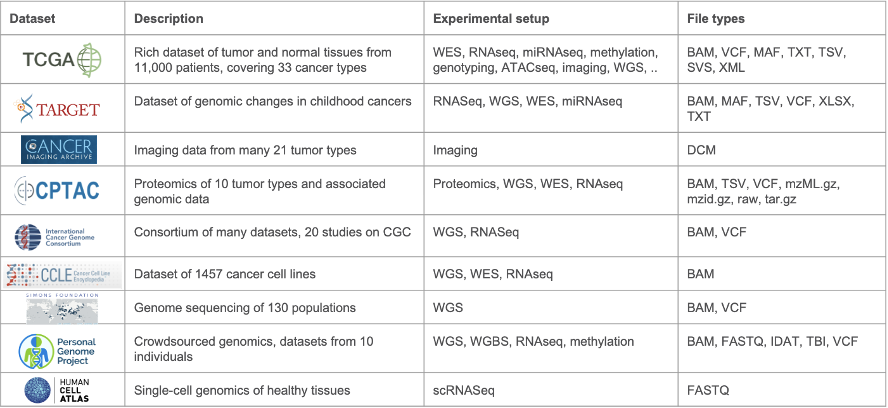
Table 1: Datasets available on the CGC. This is a subset of the numerous datasets hosted on the CGC platform and gives a typical example of the diversity in experimental setups and file types represented across the datasets.
Key CGC Features to Empower Multi-Omics Analysis
Process raw files with various ready-to-use pipelines. On the CGC, an app is a program specifically prepared so it can be run on the cloud through CGC platform. It is based on Common Workflow Language (CWL) and Docker technology. These can be simple (one command-line tool), and can also be complex (complete analysis made from several apps connected into a single workflow). More than 610 apps are already available and ready to use on CGC. They can easily be copied and run in the user’s project, modified to user needs, and users can create their own apps as well. There are no limitations regarding -omics technology, so users can port any type of analysis to the CGC. If a user is not an expert in statistics and programming, this is not a barrier to progress: most tools and packages often have tutorials and examples of analysis that can be easily reproduced with minimal technical knowledge.
The Data Browser is an interface for searching for and filtering data from public data sets. A search engine with a graphical interface, the Data Browser enables researchers to search for various types of data, enabling the discovery of different -omics experiments data this way. For a search query, users can include many different metadata fields, allowing them to better describe the relationship across the various data of interest. This is not currently possible with the typical faceted search (via data node portals). For example, Data Browser users can search for all patients with RNA-seq data and proteomics data, simultaneously. Additionally, custom metadata fields researchers can use to annotate files, which is useful for comparing data with one another.
Prepare and analyze the resulting data in joint analysis directly with the Data Cruncher. The Data Cruncher is an interactive analysis tool that uses JupyterLab and RStudio as the computational environment. It allows users to perform analysis directly where data lives (no need for transferring the data and associated egress costs). The outputs are saved directly to a CGC project. In regard to multi-omics applications, the Data Cruncher allows you to preprocess files and prepare data for analysis directly in the project. The Data Cruncher can be used for tasks such as filtering, harmonization in the preprocessing phase, writing joint data analysis, preparing custom reports and visualization, and more. In regard to multi-omics analysis, another useful feature of the Data Cruncher is the ability to explore a dataset (or new datasets) further after running initial workflows on some of your data. By doing so, users can know ahead of time which multi-omics datasets and types of analysis make the most sense to combine, before committing more time and resources. For example, if a user is using DNA methylation data from a gene with altered expression, will they even have coverage for the corresponding data in another dataset of interest? Using the Data Cruncher lets users plan their experimental procedure before committing more time and resources. In this vein, the Data Cruncher is also useful for users who want to do quick exploratory work without spending time downloading a large dataset: they can use Data Cruncher for interactive analysis in Jupyter or RStudio notebooks. Additionally, if a user has a custom analysis that is to be run many times, they can implement it as a CWL workflow on the platform and run it on a large scale, optimized for runtime and computational efficiency.
Focus on Epigenetics: Workflow Spotlights
In this blog, we will highlight three workflows specifically for epigenetics research: two developed by the ENCODE Consortium and available on the CGC platform, and one multi-omics analysis workflow developed by Seven Bridges. ENCODE stands for “Encyclopedia of DNA Elements,” and the ENCODE Consortium is an ongoing international collaboration of research groups funded by the National Human Genome Research Institute (NHGRI). The ENCODE Consortium’s goal is to build a comprehensive list of functional elements in the human genome that control cells and gene activity, including elements that act at the protein and RNA levels, regulatory elements, and more. As such, there is a focus on the study of epigenetic modifications: modifications to DNA or chromatin that affect gene expression, without changes in sequence, such as DNA methylation, histone modification/chromatin remodeling, and RNA interference. These changes can be detected with Bisulfite sequencing (DNA methylation), small RNA sequencing (RNAi), ChIP-seq (histone modification), and ATAC-seq (chromatin accessibility). In this blog, we will focus on ATAC-seq and ChIP-seq:
ATAC-seq stands for Assay for Transposase Accessible Chromatin with high-throughput sequencing. It is a method that has been utilized to study genome-wide chromatin accessibility in cancer models. This method probes DNA accessibility with hyperactive Tn5 transposase, which inserts sequencing adapters into accessible regions of chromatin. Sequencing reads can then be used to infer regions of increased accessibility, as well as to map regions of transcription factor binding and nucleosome position, as well as DNA methylation sites. Disease states, such as cancer, may exhibit unique signatures or changes in chromatin accessability profile.
ChIP-Seq (shortened from “Chromatin immunoprecipitation followed by high-throughput sequencing”) is a powerful method for identifying genome-wide DNA binding sites for transcription factors and other chromatin-associated proteins. It combines chromatin immunoprecipitation (ChIP) assays with standard NGS sequencing. The application of NGS to ChIP has revealed insights into gene regulation events that play a role in various diseases and biological pathways, such as development and cancer progression. ChIP-Seq enables thorough examination of the interactions between proteins and nucleic acids on a genome-wide scale. This method also identifies the binding sites of DNA-associated proteins and can be used to map global binding sites for a given protein. ChIP-seq signatures may be useful for identifying disease states, or for identifying passage number in cell lines.
Enhancing Epigenetics Research with Multi-Omics Analysis
In order for researchers to efficiency perform epigenetic analysis utilizing these technologies in the cloud, they will need adequate storage for large datasets, automation for long running workflows with complex settings, parallel compute nodes to quickly complete analysis, features to sharing results and data easily, as well as confidence in the reproducibility of results. The CGC is a great environment for such epigenomics research, meeting and exceeding all of these requirements. The CGC’s Public Apps Gallery has several epigenomics workflows for use on the platforms, for a variety of experimental technologies including: DNA methylation (Bismark, BitMapperBS) and Small RNA (QuagmiR, MicroRazerS), and ENCODE ATAC-seq and ChIP-seq pipelines.
Once these workflows are run and the data is collected, the next step is to gain biological insights on this data. One of the best ways to do this is to use multiple -omics data types together in multi-omics analysis. For example, you may have RNA-seq data and ATAC-seq data: the RNA-seq data is between two disease states, and may have the same sample types for the ATAC-seq data. Multi-omics analysis here would allow you to see the differentially expressed genes based on ATAC-seq peaks. You could also use this RNA-seq data together with ChIP-seq data, and ask if regions that show changes in the histone modification landscape show similar changes to RNA expression profile in the same regions.
To further highlight the epigenomics and multi-omics analysis research capabilities of the CGC platform, we will highlight the ATAC-seq and ChIP-seq workflows ported from the ENCODE Consortia, as well as our own multi-omics analysis workflow. These workflows are the ENCODE ATAC-see Pipeline, the ENCODE ChIP-seq 2 Pipeline, and the Joint Analysis of RNA-Seq and ATAC/ChIP-Seq Pipeline, respectively. These featured workflows make the CGC the ideal platform to explore chromatin accessibility and its relations with gene regulation in cancer prognosis and therapy. Combined with publicly-available, up-to-data datasets and the data exploration and analysis features described above, the CGC platform empowers epigenetic research in the cloud.
The ENCODE ATAC-seq Pipeline
One of the most well-developed, well-documented, and extensively used workflows for ATAC-seq is from the ENCODE Consortium. The ENCODE ATAC-seq Pipeline performs quality control and signal processing, producing alignments and measures of enrichment. Our bioinformatics team adapted this workflow to be cloud-optimized and implemented in CWL.The ENCODE ATAC-Seq Pipeline processes replicated or unreplicated, single-end and paired-end, ATAC-Seq data. The four major steps of the ATAC-Seq pipeline’s analysis are: pre-alignment quality control, alignment, post-alignment processing and advanced ATAC-seq-specific quality control, and peak calling in order to identify accessible regions (which is the basis for advanced downstream analysis).
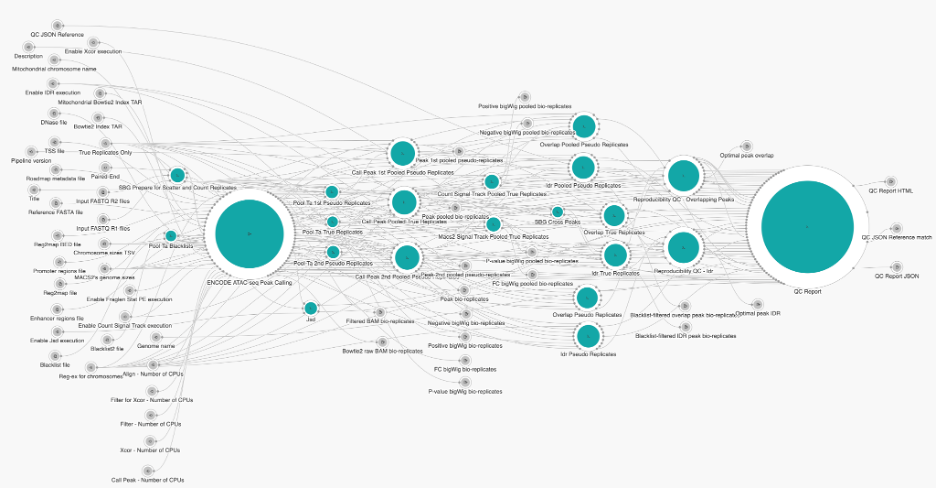
Figure 2. Snapshot of ATAC-seq Pipeline
In the table below, we have summarized the resources we found to have worked well to run the ENCODE ATAC-Seq Pipeline via Amazon Web Services (AWS) on different datasets using the Seven Bridges cloud environment. This table provides typical values for what you can expect running the ENCODE ATAC-Seq Pipeline via Seven Bridges for inputs of different sizes. The most time-consuming step of the workflow is the alignment of bio-replicates. Increasing the number of parallel instances to match the number of jobs of all the alignment steps, along with increasing “Align – Number of CPUs” based on input file sizes, will speed up the execution. Additionally, the execution can be further optimized by increasing the following: “Filter – Number of CPUs,” “Filter for Xcor – Number of CPUs,” “Xcor – Number of CPUs,” and “Call Peak – Number of CPUs.”
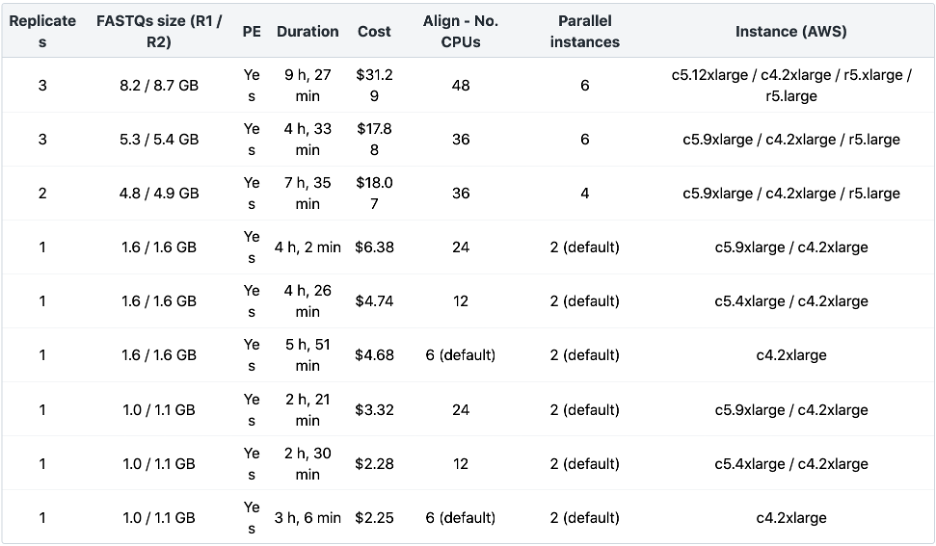
Table 2: ENCODE ATAC-seq Benchmarking
The ENCODE ChIP-Seq Pipeline 2
The ENCODE ChIP-Seq Pipeline 2 analysis studies chromatin modifications and binding patterns of transcription factors and other proteins. It combines chromatin immunoprecipitation assays with standard NGS sequencing. The workflow is based on ChIP-Seq 2 pipeline, and like its ATAC-seq counterpart, was also originally developed by ENCODE consortia. Similar to ENCODE’s ATAC-seq pipeline, this pipeline is available as a public app on the CGC, optimized and implemented in CWL by our Bioinformatics team. The ENCODE ChIP-Seq Pipeline 2 is designed for processing single-end and paired-end ChIP-Seq data. It takes a list of bio-replicates FASTQ files, reference file, index TAR file and a chromosome sizes file as required inputs. Briefly, the steps of the ChIP-Seq Analysis workflow consist of mapping of reads including duplicate removal, cross-correlation analysis, peak calling with blacklist filtering and statistical framework, applied to the replicated peaks at the end in order to assess the concordance of biological replicates.
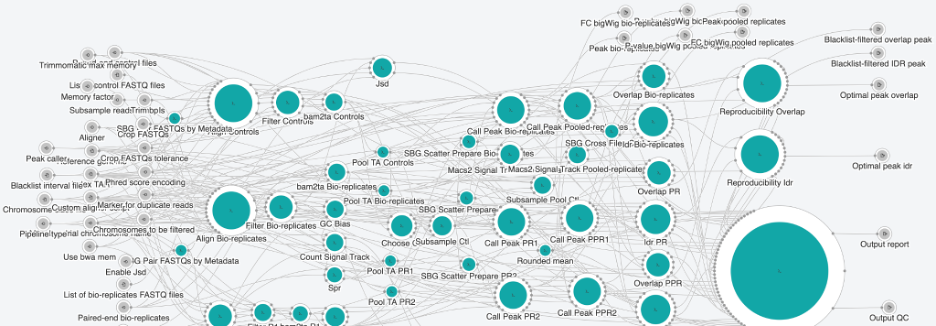
Figure 3. Snapshot of CHip-seq Pipeline 2
In Table 3 below, we have summarized the resources we found to have worked well to run the ENCODE ChIP-Seq Pipeline 2 via AWS on different datasets using the Seven Bridges cloud environment, providing typical values for what you can expect running the ENCODE ChIP-Seq Pipeline 2 via Seven Bridges for different numbers of bio-replicates, controls, and for different fastq.gz sizes. The most time-consuming step of the workflow is the alignment of the bio-replicates/controls. Increasing the number of parallel instances to match the number of jobs of all the alignment steps will speed up the execution.
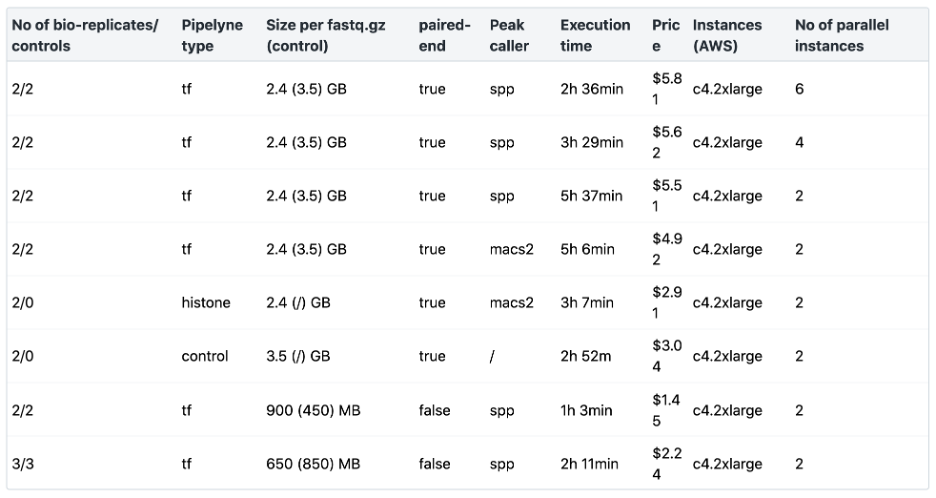
Table 3: ENCODE ChIP-Seq Pipeline 2 Benchmarking
The Joint Analysis of RNA-Seq and ATAC/ChIP-Seq pipeline
The Joint Analysis of RNA-Seq and ATAC/ChIP-Seq pipeline resulted from an CGC initiative to build a multi-omics workflow that would integrate results from several NGS technologies that provide insight into transcription regulation on the gene/transcript level as well as the epigenetic level. Thus, the Joint Analysis of RNA-Seq and ATAC/ChIP-Seq pipeline was designed to process multiple samples from RNA-Seq and ATAC-Seq or ChIP-Seq experiments, and outputs different HTML reports with graphical representation of the result, as well as multiple files in CSV format. The pipeline design is presented in Figure 4 below. It begins with comparing the transcript count and peak set data to identify differentially expressed genes and binding regions. The detected differential features are then overlapped and used for gene set enrichment analysis. The workflow consists of three functional parts – peak sets downstream analysis, gene expression data downstream analysis and combined enrichment analysis.
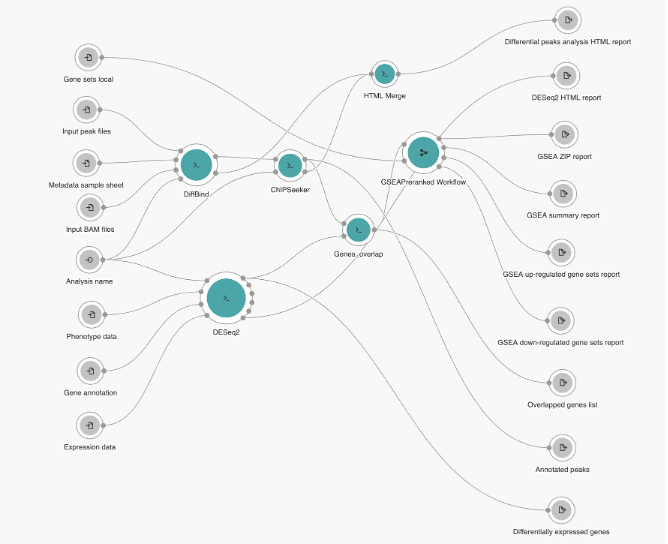
Figure 4: Joint analysis of RNA-Seq and ATAC/ChIP-Seq pipeline overview
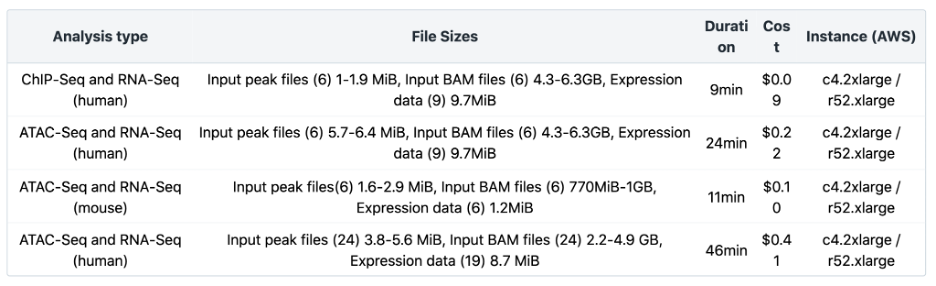
The Joint Analysis of RNA-Seq and ATAC/ChIP-Seq workflow has been benchmarked for different input file sizes and quantities. Additional information about the number and sizes of Input peak files, input BAM files and expression data is listed in Table 4 below. Testing was done using the default instance type. Additionally, the cost can be significantly reduced by using spot instances. Visit the Knowledge Center for more details.
In Conclusion
The wealth of information resulting from multi-omics analysis in concert with the epigenetics tools detailed above is but one of the many potential applications of the CGC platform. Nearly all fields of the biological sciences benefit from the insights gained from enhanced capabilities for multi-omics analysis. Seven Bridges and the CGC help to realize the full potential of multi-omics research via our cloud-based infrastructure, streamlined dataset access and analysis, and variety of tools, workflows, and interactive notebooks.
Interested in learning how to get started? Contact us today. Be sure to receive updates from Seven Bridges by following us on LinkedIn and Twitter.